Tree Diagram
Throughout my life, I’ve swayed between Windows and MacOS. I have built PCs for a very long time and you could say, doing it for friends and family was my first business venture.
My family had a PC for a little bit of my childhood, I think starting with Windows 98 and on through Windows 2000 and XP.
I had built myself a PC around the age of 18 and when I started university, I opted for an 11” MacBook Air. This device was sleek, very lightweight and perfect for lectures and taking notes. It had suitable processor for the time, a dual core Intel chip, I believe, but it was constrained by it’s storage space. I think it had 64GB of storage which, with my creative focused degree, filled up very fast.
I remember there was a tool I had used on my family computer called WinDirStat, which presented a remarkable visualisation of the storage usage of your machine. I think the Mac had an equivalent called DaisyDisk which used a slightly different, circular visualisation of your storage space. Both tools felt right at home on their respective platforms. Daisy Disk feeling aesthetic, designed and perhaps favoured form over function, whereas WinDirStat was pretty much raw function.
So why am I writing about this? Well I came across a situation where I wanted to re-create this capability in an app I was making in Swift, for iOS.
App Overview
To give some context, this app I’m creating is an exercise (as are pretty much all of the things I create) with the goal to stretch my creativity into another canvas. The app, called Portofino, is to keep track of my expenses. I know there are countless existing apps on the market, but that doesn’t stop me from making something myself. I the best way to learn something new like a coding language, is to have a real project.
The relationship between 2 concepts in the app, Transaction and Category can be visualised in the following way:

At the time of writing, the SwiftData models are as follows as well:
@Model
class Category {
    var color: String
    var label: String
    var uid: UUID

    // init...
}

@Model
class Transaction {
    var amount: Double
    var label: String
    var date: Date
    var notes: String
    var uid : UUID
    @Relationship var category: Category?
    @Relationship var vendor: Vendor?
    @Relationship var event: Event?

    // init...
}
Each Transaction had an optional Category. That way, Transactions can be grouped by Categories.
I wanted to create a visualisation of how each Category contributed to a total (in this case, the total was the sum of all Transactions in the current month).
Category Total
This was a fairly straightforward piece of logic. I wanted a mechanism to group a given set of Transactions into their respective Categories and store their total as well. This is the structure I came up with:
struct CategoryTotal: Identifiable, Equatable {
    let id = UUID()
    let category: Category
    let total: Double
}
As this wasn’t something to be stored persistently, it wasn’t marked with @Model .
I created a simple function that could return an array of these CategoryTotals given some Transactions. It would also create a “Category” for all the uncategorised Transactions as well:
public func categoryTotals(transactions: [Transaction], categories: [Category]) -> [CategoryTotal] {
        let uncategorized: Category = Category(color: "#cccccc", label: "Uncategorized", uid: UUID())

        let categorySums = Dictionary(grouping: transactions) { transaction in
            transaction.category?.uid ?? uncategorized.uid
        }.mapValues { transactions in
            transactions.reduce(0) { $0 + $1.amount }
        }

        let categoryTotals = categories.map { category in
            let total = categorySums[category.uid] ?? 0
            return CategoryTotal(category: category, total: total)
        }

        let uncategorizedTotalSum = categorySums[uncategorized.uid] ?? 0
        let uncategorizedTotal = CategoryTotal(category: uncategorized, total: uncategorizedTotalSum)

        if categoryTotals.isEmpty {
            return [uncategorizedTotal]
                .sorted { $0.total > $1.total }
        } else {
            return categoryTotals
                .sorted { $0.total > $1.total }
        }
    }
Moving on to how I could then leverage this structured data.
Grid Layout
I started by trying to create a sort of grid layout.
I wanted a collection of rows, each with a defined number of Categories in them. This had to be somewhat dynamic as it was possible that the user didn’t have very many Categories. If the user had 6 Categories for example, the first row would have the largest contributor, the second would have an uneven split for the 2nd and 3rd contributor and the third row would have the next 3, evenly sharing the width. This can be visualised like this:

The second row proved to be the most interesting however. The unequal split clearly represented that the left had Category was more dominant than the right hand one and the third row showed 3 smaller ones.
This was all very fixed and my implementation was very primitive. Here is a rough summary of how I approached it:
struct MasonryGrid: View {
	var categoryTotals: [CategoryTotal]

	if categoryTotals.count === 0 { return }

	MasonryCard(categoryTotal: categoryTotals[0])

	HStack {
		if categoryTotals.count >= 2 {
			MasonryCard(categoryTotal: categoryTotals[1]
		}
		if categoryTotals.count >= 3 {
			MasonryCard(categoryTotal: categoryTotals[2]
		}
	}

	HStack {
		if categoryTotals.count >= 4 {
			MasonryCard(categoryTotal: categoryTotals[3]
		}
		if categoryTotals.count >= 5 {
			MasonryCard(categoryTotal: categoryTotals[4]
		}
		if categoryTotals.count >= 6 {
			MasonryCard(categoryTotal: categoryTotals[5]
		}
	}
}
As you can see, this wasn’t very dynamic. I also am not totally sure this is how I made it at the time, but this was the essence of it. I was happy with my progress however, and again, this was all a learning experience.
A trip down memory lane
I was in a call with a colleague at work. She is our web-developer for our website and she was walking me through the build process before publishing an update.
During her explanation, she showed me a tree view that looked remarkably like WinDirStat which was used to represent the contribution of each section of the website to the total build size.
It had nested rectangle-tree diagrams for various folders and files. I mentioned I’d used WinDirStat a long time ago when storage space on computers was a problem and we reminisced about the good old days.
This had me thinking however. Could I try to resurrect that tree diagram in my app to display Categories in a more dynamic and perhaps appealing way?
Claude ⚔️ ChatGPT
As it typical these days, I like to bounce ideas off of AI models to get a conversation flowing. I have yet to find a person who I can do the same with, but I find using AI in this way can be quite eye-opening. I asked ChatGPT how it would define the visualisation of WinDirStat and it explained it was a common tree based design for showing relationships between different items.
I find conversations with AI are best started with a lot of context. Before you can get into the meat of productivity, you really have to set the scene. If you just jump in with “Make me a visualisation similar to WinDirStat in SwiftUI” it’ll present you with something you’re not after. It’s not surprising as there is very little context if you approach it in that way, but I started this conversation with an explanation of the idea of my app. I explained the purpose of it, my motive for creating it being an exercise in learning and outlined my data model.
I explained that I was intrigued to try to make a tree diagram with my data and it assured me that it would be a simple task.
Turns out, it wasn’t.
A tree diagram might not be complex by any means, but ChatGPT just couldn’t get there. I would write a bunch of code myself and leave gaps where I needed help and would share the code with it. It would then return me something that was somewhat familiar but not really my code any more and it wouldn’t work as I expected. This meant that I couldn’t really dive in and find out what was wrong and it left me unsatisfied.
I knew I was somewhat close in my approach, but alas, I couldn’t cross the line.
ChatGPT ❌
As I write about in another article on this site, I am also a user of Anthropic’s Claude interface, and thought I would set that model the same challenge.
Typically I find that Claude is a better model for coding and presents it’s results in a better way. I fed that model with the same context and tasked it with helping me cross the line.
I made the mistake of pasting the code that had come from ChatGPT and what came back was too different from my understanding that, even if it had worked wouldn’t really fit the purpose of this app which was ultimately to learn.
Again, it failed to present the visualisation I wanted and I just couldn’t debug it.
Claude ❌
Perhaps I didn’t understand what I really wanted and I wasn’t explaining it well enough. At this point, I took a step back and started this particular view again.
My process
By this point, I knew that the right approach wasn’t to use alternating V and H stacks, but to use ZStack’s with defined dimensions and offsets.
I needed to create a function that could, given a set of CategoryTotals, return me a list of rectangles.
I took some time to think about what information I needed to contain in the result from that function and came up with the following:
struct CategoryRectObject {
    let rect: CGRect
    let category: CategoryTotal
}
The rect would be a CGRect that would contain an origin (CGPoint), and a size (CGSize)
The category would be a reference to my CategoryTotal (described above)
I wanted the visualisation to swap between splitting the remaining space in the view horizontally and vertically. Each time drawing a rectangle to fill the correct space and then recording the remaining space.
To start with, I needed to get the area available to this View. I leveraged GeometryReader for this:
GeometryReader { geometry in
	// View
}
The geometry object had a handful of useful properties, but the .size was the most important one.
I had to create a var that would update with the remaining space every time a rectangle was drawn. That remaining space would then be split with the next Category etc.
I also needed to keep track of the total of all the remaining Categories in order to calculate the percentage of the remaining space the next Category would occupy.
The basic idea was as follows:
let categoryTotalSum = categoryTotals.reduce(0) { $0 + $1.total }

let categoryRectangles = createRects(
    categoryTotals: categoryTotals,
    initialRectangle: CGRect(origin: .zero, size: geometry.size),
    categoryTotalSum: categoryTotalSum
)

func createRects(categoryTotals: [CategoryTotal], initialRectangle: CGRect, categoryTotalSum: Double) -> [CategoryRectObject] {
    var rects: [CategoryRectObject] = []
    var remainingRectangle: CGRect = CGRect(origin: .zero, size: initialRectangle.size)
    var split: Split = .vertical // Basic enum with .vertical and .horizontal
    var remainingTotal = categoryTotalSum

    for categoryTotal in categoryTotals {
        let (currenctRectangle, leftoverRectangle) = calculateNewRect(remainingRectangle: remainingRectangle, percentage: categoryTotal.total / remainingTotal, split: split)
        rects.append(CategoryRectObject(rect: currenctRectangle, category: categoryTotal))
        remainingRectangle = leftoverRectangle
        split = split == .vertical ? .horizontal : .vertical
        remainingTotal = remainingTotal - categoryTotal.total
    }

    return rects
}

typealias RectPair = (CGRect, CGRect) // Basic structure to hold a before and after pair of CGRects

func calculateNewRect(remainingRectangle: CGRect, percentage: Double, split: Split) -> RectPair {
    // First, understand where the first rectangle starts
    let startX = remainingRectangle.origin.x
    let startY = remainingRectangle.origin.y

    // Then, work out how big it is. This depends on if it's a .horizontal or .vertical one
    let width = split == .horizontal ? remainingRectangle.width * percentage : remainingRectangle.width
    let height = split == .horizontal ? remainingRectangle.height : remainingRectangle.height * percentage

    // Store those values as a CGRect
    let newRect = CGRect(x: startX, y: startY, width: width, height: height)

    // Now work out what remains
    let leftoverStartX = split == .horizontal ? startX + width : startX
    let leftoverStartY = split == .horizontal ? startY : startY + height

    let leftoverWidth = split == .horizontal ? remainingRectangle.width - width : remainingRectangle.width
    let leftoverHeight = split == .horizontal ? remainingRectangle.height : remainingRectangle.height - height

    // And store that as a CGRect
    let leftoverRect = CGRect(x: leftoverStartX, y: leftoverStartY, width: leftoverWidth, height: leftoverHeight)

    // Give them back
    return (newRect, leftoverRect)

}
Too Many
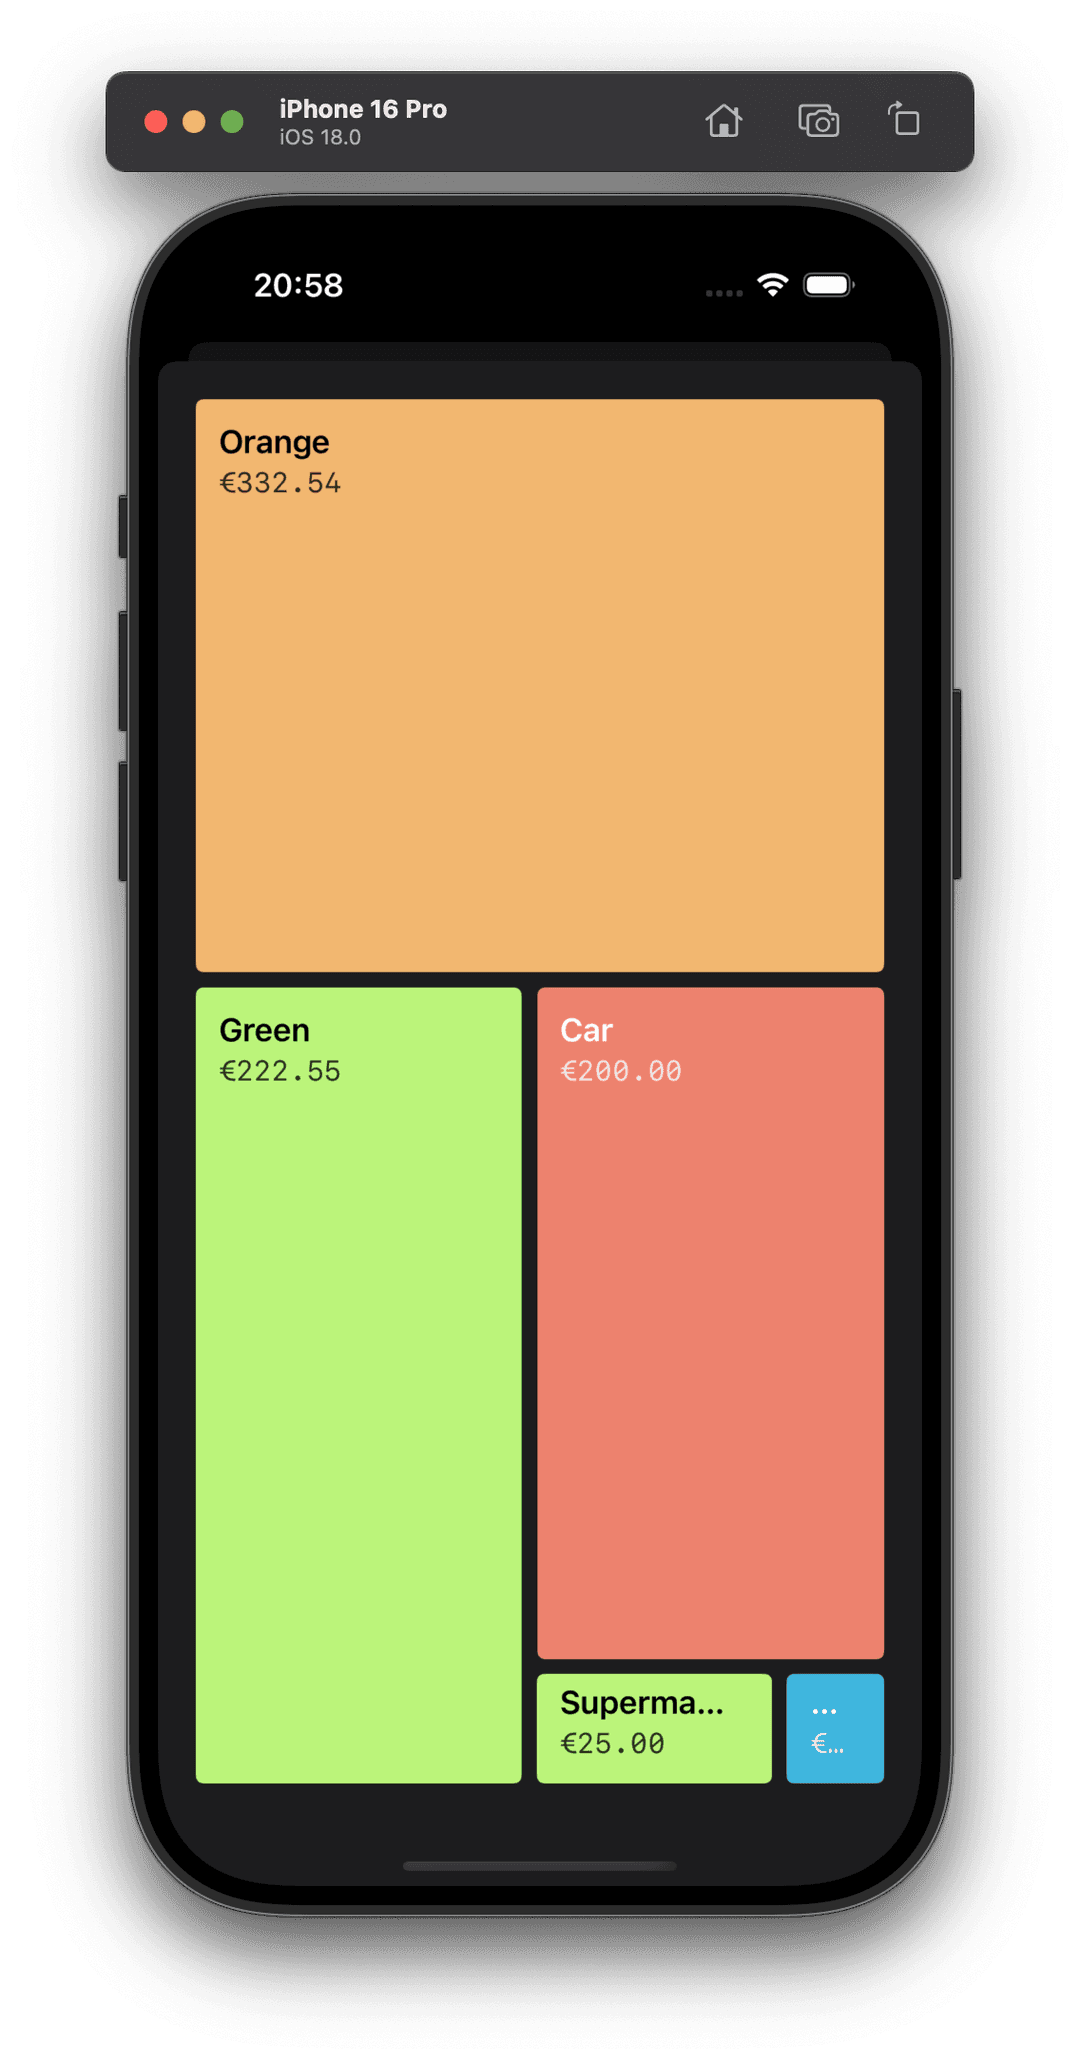
When testing this design with a handful of Categories I realised that I needed to put a cap on them somehow. I decided to add a max number of CategoryTotals as well as a minimum area a Category could occupy. That stopped me having tiny Categories huddled in the bottom right corner.
Done!
Thanks for reading this far. I hope this has been insightful in some way.